Why and How to Apply Customer-Behavior Analytics on Your Self-Storage Facility Website
Getting self-storage customers to your website is only half the battle. You also need them to interact with your pages. Understanding where users spend their time can help you improve your site and provide a more satisfying online experience. Behavior-analytics tools can deliver this insight. Find out how.
March 14, 2023
When it comes to self-storage website optimization, understanding your visitors is key. Think about it: If you don't know how people are interacting with your website, how can you possibly know what they do and don’t like, or how to improve?
You may already be collecting certain analytics for your website like visits, pageviews, and bounce and exit rates, and thinking that’s enough. But these metrics only tell you what happened, not why it happened. That's where behavior analytics come in. This involves tracking activity on the website, so you can improve the user experience (UX).
We've all heard the saying, “You can't improve what you can't measure.” When it comes to understanding your website’s customer-conversion rates, measuring user behavior is crucial. Whether your goal is to get visitors fill out a contact form, make a reservation or rent directly from the site, you can’t increase conversions if you don’t know what your customers want and expect.
By analyzing user behavior on your website, you’ll be able to identify problem areas that may be preventing customers from becoming tenants. For example, are they having trouble finding what they need? Are they bouncing off a particular page? Are they getting lost in the checkout process? Behavior analytics can help you answer these questions and more.
Understanding Behavior Analytics
To effectively analyze user behavior and optimize your self-storage website, it's important to understand the different types of activity that can be tracked. Following are a few of the most common and what they can reveal.
Click and taps. As the names suggest, clicks (desktop computers) and taps (smartphones and tablets) show where on the webpage users are taking actions and interacting with your website. They also show if a customer is trying to access elements of your site that aren’t clickable.
Mouse movement. By watching how a customer moves their mouse around, you can get a good sense of the elements they’re paying more attention to, whether that’s certain text, an image or a button. Conversely, it’ll also show you what areas of your website the user is ignoring. Lastly, mouse tracking will show you how your customer is progressing through the page. They may not be following the path you intended.
Scrolling. This shows you how far down the page your customer is willing to go. It may reveal that you’ve got your call to action (CTA) too far down the page and customers aren’t scrolling enough to get to it.
Ultimately, you want to be see how your customers navigate through your website, including the order in which they move between pages, what pages they spend more time on, the elements they skip, and the actions they take before they leave.
Heat Maps
To get the above-mentioned behavior analytics, you need specific tools. A popular one is a heat map, a data-visualization tool that uses color to indicate user activity, typically going from red (most active) to blue (least active). There are several types of heat maps. Each shows different information about your self-storage website.
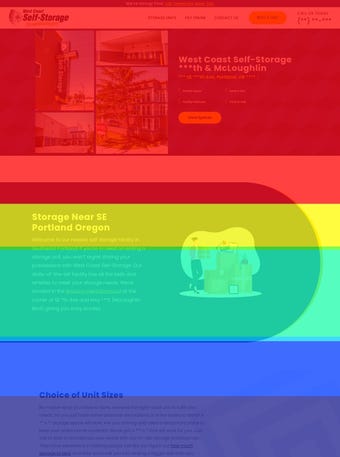
Scroll heat maps. These track how far down the page users are scrolling. They can be especially useful for understanding how users engage with long-form content. If a lot of users aren't scrolling past a certain point, it could indicate a problem with the content or design. Most people stay “above the fold,” the area readily seen on a screen without having to scroll. It makes sense to put your CTA buttons and menu items in this area rather than further down.

An example of a scroll map
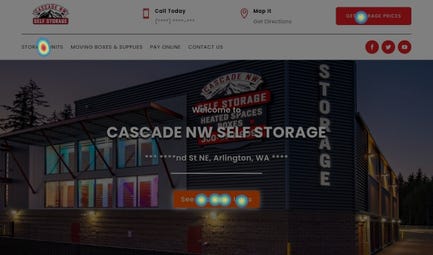
Click heat maps. These show where your website visitors have clicked or tapped. UX designers use this to look for opportunities to improve the site and identify bugs. Notice in the image on the left that there are numerous clicks on the main CTA “See Available Units.” The heatmap on the right shows the most clicks on the hamburger menu, which could indicate users aren’t liking the CTA “Start Storing Today.”


(Above left) A click heatmap showing numerous clicks on the call to action; (Above right) A click heatmap showing a majority of clicks on the main menu
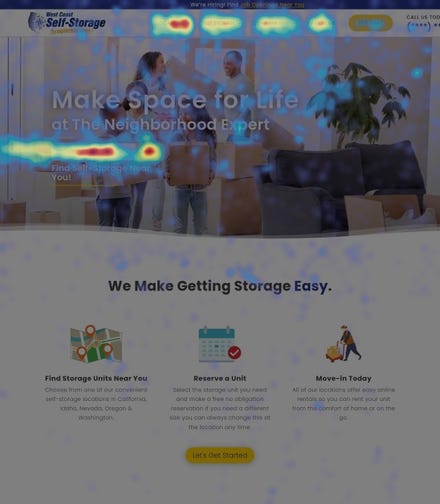
Movement heat maps. These maps show where users have moved their mouse on the screen, giving you a clear picture of what captured people’s attention the most. As you can see in the following example, the visitors keep their mouse around the menu items and search field.

A movement heatmap tracking where users have moved
their mouse on the screen
When analyzing your heat-map data, keep in mind that more clicks or longer attention time don't always indicate positive engagement. Sometimes, higher clicks on a specific area can indicate that users are having trouble completing a task or finding what they’re seeking. Or it’s an area they expected to be clickable but isn’t. Finally, run heat-map tests on your desktop computer, but look at the mobile and tablet view as well.
Session Recordings
Another popular behavior-analytics tool is session recording, otherwise known as session replays. These capture the real actions taken by your self-storage website visitors. You can watch as they move around from area to area or page to page, seeing what sections they spent the most time on and the elements on which they click. You’ll also see what they ignored and any places they appear to get stuck.
After recording visitor sessions for a few weeks, you’ll start to see trends. For example, you may notice your customers moving back and forth from page to page, which may indicate they aren’t finding the information they need. You may also see them scrolling wildly or repeatedly clicking on elements, which might indicate a broken link or missing CTA. It may also show you pages that are loading incorrectly or other design flaws.
Behavior-Analytics Software
There are several companies that offer complete suites of behavior-analytics tools. Some of the most popular are Crazy Egg, Hotjar, Inspectlet, Microsoft Clarity and Mouseflow, but there are many others. Most provide the tools mentioned above, but how detailed the data is can vary. Plans run from free to as high as $3,600 per month. At my company, we use the business version of Hotjar. It gives us 500 daily session recordings, unlimited heat maps, filtering and segmentation, and the ability to integrate with a number of other tools such as Google Analytics.
By using behavior analytics to identify problem areas on your self-storage website, and then using that information to optimize key pages, simplify the checkout process, improve the mobile experience and make data-driven decisions, you can improve customer-conversion rates. Continuously monitoring and optimizing your website helps you ensure you’re always providing the best possible user experience for customers.
Derek Hines is a writer for West Coast Self-Storage, a self-storage management, acquisitions and development company with facilities in California, Idaho, Nevada, Oregon and Washington. He writes extensively on all subjects related to the storage industry. For more information, call 877.611.8550.
About the Author(s)
You May Also Like


