The current state of the U.S. self-storage industry reflects the continued economic uncertainty of the overall economy. Self-storage is in slow but steady recovery, and it appears it will be one of the firstif not the firstreal estate sectors to pull through. This article examines the business from the perspective of supply and demand, facility operating performance, the investment market and more.
December 27, 2010

Self-storage is proving to be resilient under economic uncertainty, despite having supplied enough storage units to satisfy the pent-up demand it had been building toward for 40 years. The industry has now reached a fork in the road to maturity, similar to the one the hotel industry reached following the Great Depression. One road offers opportunities while the other has challenges.
The opportunities will be for those with professional management skills and access to operating capital necessary to compete in todays marketplace. These travelers include the public companies, larger operators and institutional investors. The challenge will be for the owners and operators who have enjoyed a relatively safe, secure and profitable investment that required only minimum management skills and little operating capital.
Pockets of Recovery
If weve learned one thing about the performance of self-storage during this recession, its that we can no longer generalize about anything, including the rate of recovery. There are pockets of revival, and the rate varies from one location to another, even within the same metropolitan area.
Pockets that were hit the hardest by the downturn, for instance Florida and Michigan, are slower to recover than other areas. Some markets, such as California and Texas, were slower to feel the impact of the recession, and are slower to recover. The hardest hit areas of the country are those that experienced the most overbuilding and the greatest loss of jobs. Markets like Washington, D.C., with its large number of government employees, has felt the recession the least.
Supply and Demand
No discussion about the state of the self-storage industry would be complete without addressing the issues of supply and demand. Nationwide, self-storage went into this recession without having an excessive oversupply of new facilities. However, there were pockets of overbuilding that have hadand will continue to havea negative impact on performance for a period of time.
Contrary to popular belief, the decline in the operating performance was not caused by a recent huge amount of new construction. It was caused by the gradual but fairly steady addition of new space to the existing inventory over many years. (See accompanying graph, Value of Self-Storage Construction.")
The current nationwide inventory of storage equates to one storage unit for every eight to 10 households. This takes into consideration commercial users. Many markets have even fewer households for every existing unit. When put into those terms, future demand takes on a whole new meaning.
The good news is theres been a 23 percent decline in the number of projects in the pipeline, according to the latest statistics from The Dodge Project Center, which tracks construction projects. Any new construction has been limited to additions, alterations and few new starts.
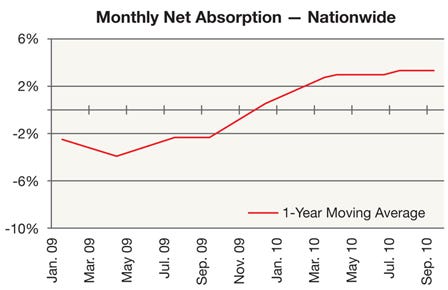
Based on the rental activity of more than 900,000 units tracked monthly by Self Storage Data Services (SSDS), a Los Angeles-based provider of self-storage operating-performance statistics, demand for storage started to increase in April 2009 and continues at a fairly consistent rate. The increase in net absorption has been the result of a slowdown in the number of tenants moving out and an increase in new tenant move-ins.
The accompanying graph (Monthly Net Absorption Nationwide) illustrates the long-term trend in net absorption of units based on the net difference in the ratio of move-ins to move-outs. In September 2010 (the latest data available at the time of this writing), there were 3 percent more tenants moving into storage than moving out. In estimating the future demand for storage, consideration must be given to the impact of 79 million baby boomers hitting retirement age and not knowing their propensity to use storage in retirement, or their ability to afford it.

Operating Performance
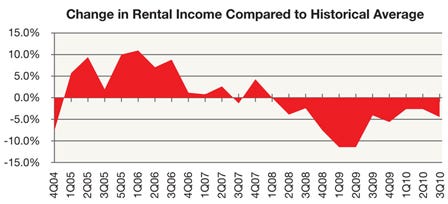
The national operating performance of facilities peaked in 2006 as demonstrated by the decline in the rate of change in rental income compared to the historical average. In the first quarter of 2006, facilities were operating at 10 percent above their historical seven-year average. The rate of change in rental income compared to the historical average became negative in the second quarter of 2008 and reached a low point a year later.
Today, facilities nationwide are operating at about 5 percent below their historical average. The degree to which facilities are operating below or above their historical average varies by location, which accounts for the varying rates of recovery. For instance, in the third quarter of 2010, Washington, D.C., was operating at 10 percent over its historical average, whereas Las Vegas was operating at 10 percent below. Considering the industry has satisfied the pent-up demand, serious questions arise regarding the future rate of rental increases and the impact it will have on facility value.

Performance Indicators
The impact of changes in asking rental rates and concessions is evidenced in a facilitys physical occupancy and rental income. The majority of operators have tried to hold rates as high as possible during the recession; as a result, physical vacancy has increased, but not as much as it might have without concessions. The type and cost of concessions varies from location to location, and today approximately two-thirds of facilities offer them. The good news (and another sign of recovery) is the number of operators offering concessions has started to decline, as has the dollar impact they have on rental income.
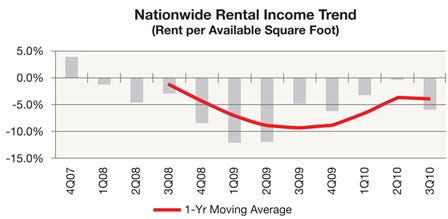
The accompany rental-income graph illustrates how income stopped declining in the second quarter of 2009 and has been trending upward. However, in the third quarter of 2010, the markets softened compared to the third quarter of 2009, reflecting consumers continued concern over the pace of the recovery and the creation of jobs.
Based on the trend in rental income at more than 6,000 facilities nationwide, it appears self-storage is in recovery. However, like the overall economy, it will be slow and steady.

Investment Market
The self-storage investment market has returned, and those investors who retrenched during the downturn are embarking on an aggressive but selective acquisition strategy. There are many more buyers in the market than investment-quality assets. All four real estate investment trusts are active, as are the larger operators and some newcomers to the industry.
Investors sense the rich opportunities that await and believe the worst is over, but are frustrated at the lack of quality investments. As such, they are becoming more aggressive in their pricing. At the same time, owners are becoming more concerned with the speed of the recovery and worried about the uncertainty surrounding their debt. They are, therefore, starting to accept the new reality of the marketplace.
There are still too few closed transactions to define capitalization rates by geographical area and facility type. The best indicator of the cap-rate range comes from the analysis of current listings supplied by the most active self-storage brokers. The accompanying table (Implied Cap Rates Based on Asking Prices) illustrates the implied rate based on asking prices and net operating income, sorted by facility size. The implied cap rate sets the lower limit of the range, considering the properties will most likely sell for a price less than asking.
There are very few high-quality, investment-grade (class-A) facilities available today, and the few that have sold did so with cap rates in the 7.5 percent to 7.75 percent range, or sometimes lower based on the trailing 12 months net operating income. Investor pricing takes into consideration the potential upside for revenue even on otherwise stabilized facilities once the economy totally recovers, which means the anticipated overall return will be higher.
A Look Ahead
The current state of the U.S. self-storage industry reflects the continued economic uncertainty of the overall economy. Self-storage is in slow but steady recovery, and it appears it will be one of the firstif not the firstreal estate sectors to pull through.
All markets are in constant flux given all the uncertainty in the job market, and so the successful operators are the ones who are keeping a close eye on ways to gain the competitive advantage. For most, that means effectively employing the use of concessions to help drive revenue.
Self-storage is entering a new era that offers challenges and opportunities. The biggest opportunities are for external growth through acquisitions, as new construction will be minimal. The challenges for the smaller operators will be met by some with the use of third-party management companies and self-storage call centers.
Self-storage has proven its ability to outperform most other real estate sectors and has made a giant step toward becoming recognized as a core asset.
Charles Ray Wilson is the founder of Self Storage Data Services Inc., an independent research firm that maintains the nations largest database of self-storage operating statistics. Hes an internationally recognized leader in providing independent research on the self-storage industry. For more information, visit www.ssdata.net .
About the Author(s)
You May Also Like


